TDL4 Boot Debugging Companion
A companion information up for the "A look into TDL Bootup". Please be noted that this is a legacy analysis, to serve as reference for academic purpose to those who are curious about debugging Windows OS from Master Boot Record (MBR) code infected with a bootkit.
Introduction
After many years of my paper being locked in a vault, I have released it as it is no longer relevant in the age of EFI and to to serve as academic purpose for reference and learning. This is a companion post for a Legacy Analysis of TDL4 Boot Up. To see the Malware boot Up under a Debugger you may see the GIF and Videos under https://github.com/kyberzo/z3r0cyb3rLegacy/tree/main/Bootkit-TDL4/assets, other artifacts can be found on the Main folder Bootkit-TDL4
Pre-requisites
- VMWare Workstation - Virtualization for an operating system is needed for remote debugging of the OS. As this is an old analysis, I have not tested it on other Virtualization. There is no need for the latest VMware. An Older version will suffice. For this case, it is highly recommended to use VMWare as this companion dependently uses VMWare.
- Ida Pro or Home - minimum version of 6.1, this is the version released with 64 bit debugging support.
- Unfortunately Ida Free does not have GDB debugging feature active.
- Windows 7 64-bit OS Symbols - Windows Symbols will help a lot on providing the necessary symbols for the files to be analysed during the boot sequence, no need to obtain all symbols, at minimum the following symbols are necessary; bootmgr, winload, ntoskernel. You can easily obtain these symbols by using WinDbg to remote boot debug.
- Windows 7 64-bit TDL Infected - this is an old or legacy malware that is no longer relevant in this modern system with secure boot and UEFI/EFI. You may need an old installer for Windows 7 and install it on VMWare with IDE hdd virtualization to properly infect the machine, preferably unpatched by KB2506014.
While This is for Following a Windows Boot Up Sequence Infected with TDL4, it can also serve as guide for following a Non-infected Windows 7 64-bit. Serving as a companion to understand deeper on the Windows Boot Up as described in Windows Internal Book chapter “Startup and Shutdown”
Windows Boot Debugging
This step is only to collect the symbols (pdb) file which will be used further along the remote debugging with gdb. While doable, it is not recommended to have Windows boot Debugging Enabled and at the same time remote debugging with GDB or dual remote debugging with WinDBG and GDB.
Microsoft provides a Debugger Tool called WindDBG, this debugger tool can be used to remote debug a Windows Operating System, additionally the Windows Operating System provides options to enable boot debugging. While WinDBG is the best tool for debugging a Windows Operating System Kernel and its processes. WinDBG provides more information such as Memory Layout, Drivers, Threads, Context and many others. WinDBG will not suffice for our purpose that is to debug from a system level or at the Master Boot Record code level, which we will show here. However we will utilize the WinDBG to collect the Symbols as part of the requirements to be used in another Tool with Ida and GDB.
To collect the Symbols we can enable boot debugging for Windows as far back to bootmgr. To enable boot debugging and kernel debuging for Windows 7 and beyond use the bcdedit on a command shell with administrative privilege.
Enable Boot debug in Bootmgr
1
bcdedit /bootdebug {bootmgr} ON
Enable Boot debug in Winload
1
bcdedit /bootdebug {current} ON
Enable Boot debug in Kernel (ntoskernel)
1
bcdedit /debug ON
Configure the debugger interface in this case serial on port 1
1
bcdedit /dbgsettings serial debugport:1 baudrate:115200
Refer to your WindBG symbols server location and take note of its path. It is highly recommended to copy or put the symbols file (*.pdb) on a separate folder.
Configure VMWare Image for Serial Port Remote Debugging
- Add a Hardware Serial Port and pipe it to a named pipe.
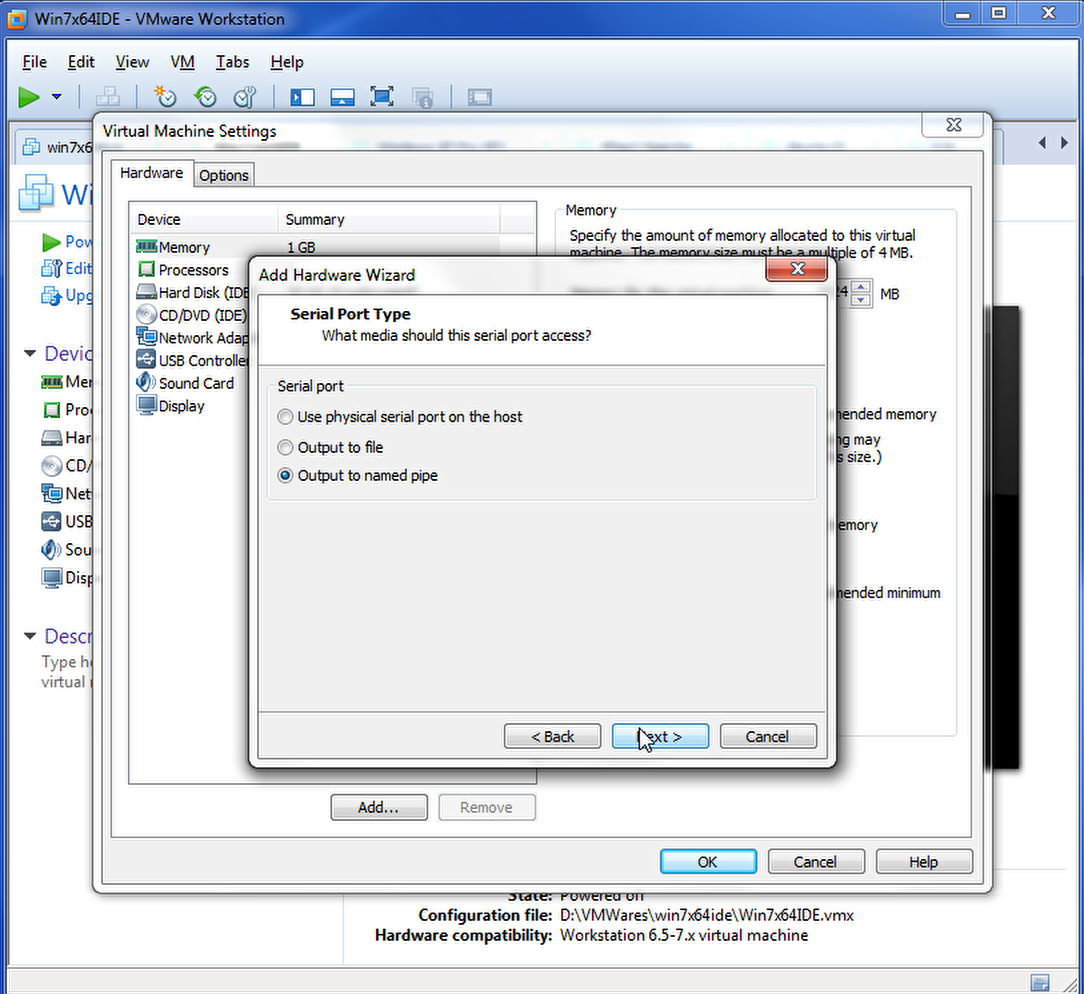
- Configure the named pipe and set the other end as an Application
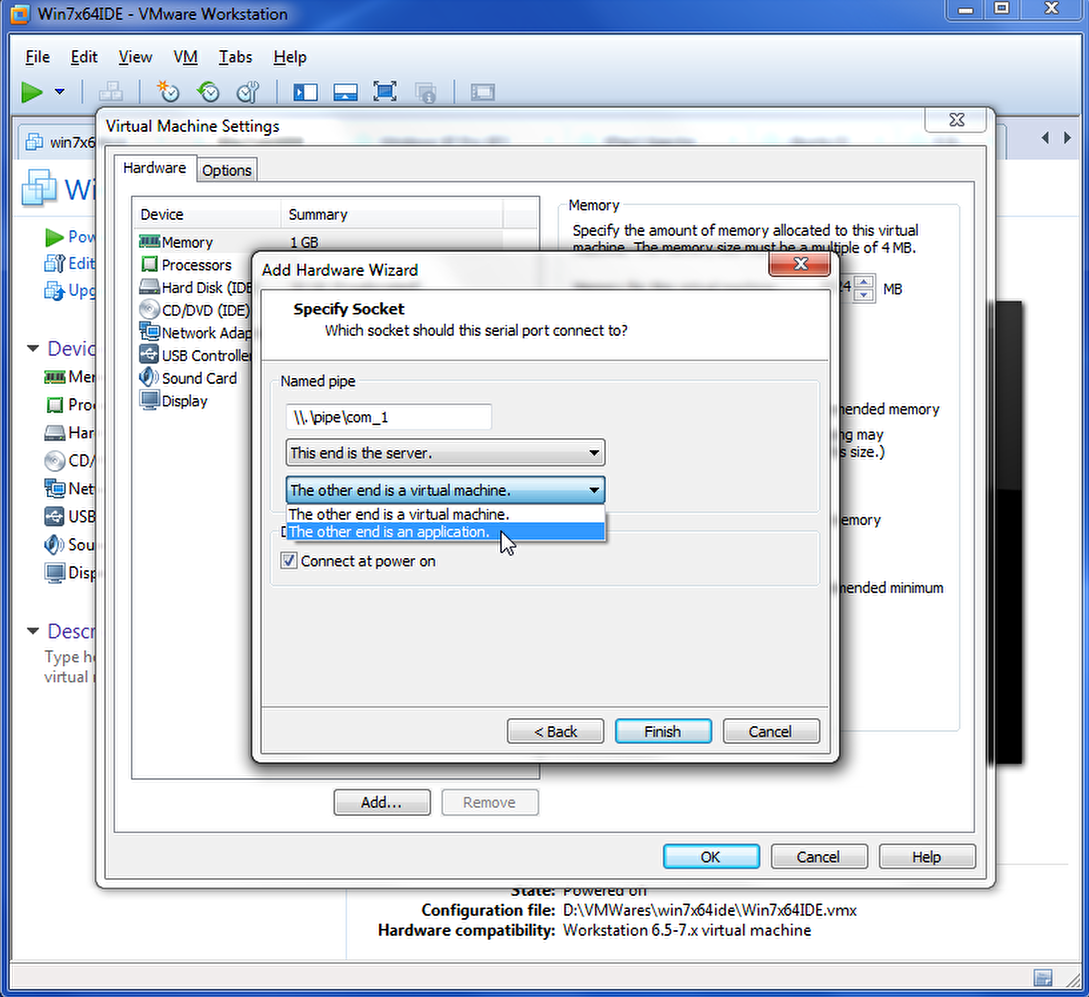
- Optionally I always prefer to “Yield on CPU Poll”
Quick Demo Verify WinDBG Debugging and Collect Symbols
To Initialize Remote debugging Session, start the target machine and launch the WindDG then remote connect using “Kernel Debug”. This will launch a Serial Port Remote Debugging. Once connected Initialize the Break on next Boot, see Video Below:
System Level (MBR code) Boot Debugging with Ida GDB
Now that we have seen the boot debugging capability of WinDBG for Windows Boot Debugging it clearly shows lacking the capbality of debugging far back before bootmgr. This is not a problem, different tools serves different purpose and provides different capability. With this regard we can utilize GDB debugger, while GDB is powerful it is not the most suitable debugger alone for Windows Operating system. We can however use other Applications like Ida that provides the GDB debugger integrated to it application providing features like symbols loading.
Configure VMWare Workstation GDB Debugging Server
VMWare Workstation has a hidden feature not configurable in the User Interface. To Enable GDB VMWare Debugging set the following in the VMWAre Virtual Machine Configuration file (.vmx):
Enable Debugging at Boot of the Virtual Machine
This configuration is responsible for telling VMWare to pause at the VM’s system level and activate the GDB debugger at port 8832, which in this case is the VMWare BIOS, this will await for a debugger to attach at firmware level. This configuration is usually paired with the configuration below. Do take note that same configuration is available for 64-bit, this is more applicable to UEFI systems, know which architecture to debug into.
To let the Guest Virtual Machine Continue, user must press “play” button within the Virtual Machine Screen if your VMware supports it, otherwise it will just be at paused and show black screen.
1
monitor.debugOnStartGuest32 = "TRUE"
Enable GDB Debugging for 32bit Architecure
This configuration is responsible for telling the VMWare to activate the built-in GDB debugging server to start listening at port 8832.
1
debugStub.listen.guest32 = "TRUE"
Enable GDB Debugging for 64bit Architecure
This configuration is responsible for telling the VMWare to activate the built-in GDB debugging server to start listening at port 8864.
1
debugStub.listen.guest64 = "TRUE"
Additional Hide Debug Breakpoints
This is optional, it is great for debugging user mode application for other Operating System (ie not Windows as its better to use Windows based debugger than GDB)
1
debugStub.hideBreakpoints = "TRUE"
Ida GDB Debugging with VMWare
Crash Course for 16bit Real Mode and Master Boot Record
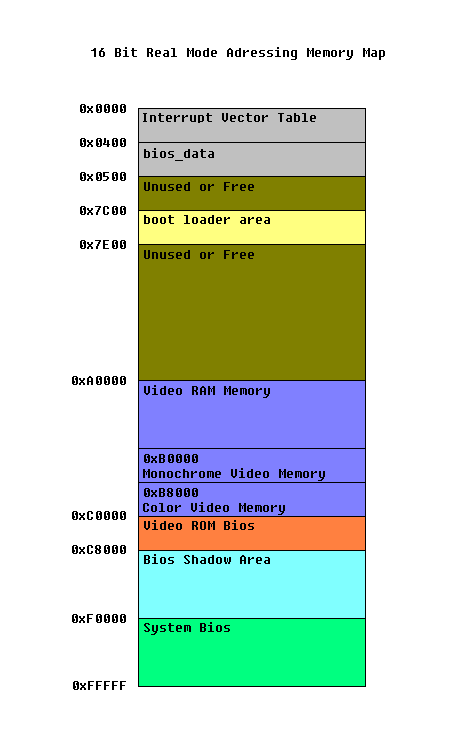
Before we delve into the boot debuging, there are some basic information that may be needed to keep in mind. These are that BIOS is a 16bit Real Mode Addressing, just think of it as a chunk of 64Kb memory with segment:offset adressing, where each parts of the memory has its dedicated location. For now all we need to know is that adress where the transfer will be provided to the Master Boot Record (MBR) code is at adress 0000:07C00 and this is where you put a break point when you connect your debugger. To Also make sense of the code and make Ida able to properly recognize the code declare the memory or the adress as 16bit Real Mode, no worries a script is provided for this.
Crash Course of Windows Boot Up and Architecture Transition on BIOS System
On a Legacy System BIOS at the MBR code it starts on a 16 bit Real Mode Adressing. 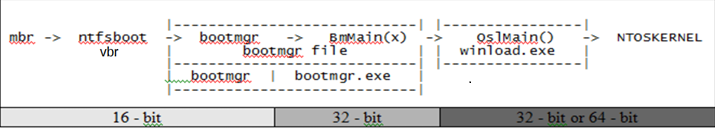
- MBR - Master Boot Record
- Locate and Identifies the active Volume Boot Record (VBR) then loads it at 0:7C00 and transfer execution.
- VBR - Volume Boot Record
- contains the information about the file system and code necessary to load the operating system, since this is windows and uses the ntfs file system I prefer to this as NTFS Boot
- locate the “bootmgr” on an NTFS file disk structure.
- loads the bootmgr at 2000:0000 and transfer execution
- bootmgr
- compse of 2 parts:
- 16 bit
- prepares memory addressing to 32-Bit Protected Mode
- decompress and loads the embeded PE File
- transfer execution to the PE File’s main (BmMain())
- 32 bit
- I refer to it as the Windows Boot Manager providing the basic boot management functionality.
- reads Boot Configuration Data (BCD)
- display operating system menu selection
- provides advanced boot options and recovery when invoked
- selects the current Windows loader (winload.exe) by default if there is only one entry
- Identifies the winload.exe property if to enter a 64bit mode or continue as 32Bit.
- additionally identifies if to resume Windows (winresume.exe)
- 16 bit
- compse of 2 parts:
- winload.exe (32Bit or 64Bit)
- The Windows Operating System Loader
- Loads the windows kernel and other necessary boot components ie:
- hal.dll (hardware abstraction layer)
- ntoskernel (The Windows Kernel)
- depends on the previous loder if its 32bit or 64bit architecture
- initialization, management and execution of windows operating system
- further loading/execution of other drivers and execution of user space programs.
Transitioning from 32Bit Debugging To 64Bit Debugging
- On transfer of execution at bootmgr 32bit BmMain() load the pdb symbols, loading the symbols will provide you more contect on the disassembly such as the function names.
- Locate the function Archx86TransferTo64BitApplicationAsm(), this is the actual routine that will transfer the execution to the 64bit winload.exe
- You will notice a jmp far ptr 0x10:0x450ADA
- The address is actually just below this jmp instruction. You may add a break point in this address.
- Once a breakpoint is established, you may run the system and connect using a 64Bit debugger.
- without setting the initial breakpoint at 32bit the system will proceed to 64bit without a breakpoint and will only break when a debugger is connected at port 8864.