Kubernetes Detection Lab with Tetragon and Splunk
Build a Kubernetes security detection lab using Tetragon for eBPF-based runtime monitoring and Splunk for centralized SIEM analysis.
Introduction
In today’s cloud-native landscape, security observability is critical for detecting threats and understanding system behavior in Kubernetes environments. Traditional security tools often struggle with containerized workloads, requiring either application changes or generating excessive overhead. This is where Tetragon shines—providing deep, kernel-level visibility using eBPF technology without modifying your applications.
In this comprehensive guide, I’ll walk you through building a complete Kubernetes security detection lab that leverages Tetragon for runtime security observability and Splunk as a centralized SIEM platform. This lab is perfect for security practitioners, DevOps engineers, and anyone interested in hands-on experience with cloud-native security tools.
What is Tetragon?
Tetragon is a flexible Kubernetes-aware security observability and runtime enforcement tool developed by Cilium. It uses eBPF (extended Berkeley Packet Filter) to provide deep visibility into system behavior at the kernel level, offering unprecedented insight into what’s happening in your containerized environment.
Key Capabilities
Tetragon enables real-time monitoring and detection of:
- Process Execution: Track process creation, arguments, and execution chains with full context
- File Access: Monitor file opens, reads, writes, and modifications across the filesystem
- Network Activity: Observe network connections and traffic patterns at the socket level
- System Calls: Capture privileged operations and system-level events in real-time
- Kubernetes Context: Correlate all events with pods, namespaces, and container metadata
Why Tetragon?
What makes Tetragon particularly powerful is that it:
- Operates transparently at the kernel level without requiring application changes
- Provides rich context by automatically correlating events with Kubernetes metadata
- Delivers minimal performance overhead thanks to eBPF’s in-kernel execution
- Supports custom detection policies through TracingPolicy custom resources
- Integrates seamlessly with the Cilium ecosystem for comprehensive security
Lab Architecture Overview
Our detection lab consists of the following components:
1
2
3
4
5
6
7
8
9
10
11
12
13
14
15
16
17
18
19
20
21
22
23
24
25
26
┌──────────────────────────────────────────────────────────┐
│                      Proxmox Host                        │
│  ┌────────────────────────────────────────────────────┐  │
│  │           Kubernetes Cluster (4 nodes)             │  │
│  │  ┌─────────────┐  ┌─────────────────────────────┐  │  │
│  │  │ Master Node │  │     Worker Nodes (3x)       │  │  │
│  │  │             │  │                             │  │  │
│  │  │ • kubeadm   │  │  ┌────────────────────────┐ │  │  │
│  │  │ • Cilium    │  │  │  Tetragon DaemonSet    │ │  │  │
│  │  │             │  │  │  (eBPF monitoring)     │ │  │  │
│  │  └─────────────┘  │  └───────────┬────────────┘ │  │  │
│  │                   │              │ JSON logs    │  │  │
│  │                   │  ┌───────────▼────────────┐ │  │  │
│  │                   │  │ Fluent Bit DaemonSet   │ │  │  │
│  │                   │  │ (Log forwarding)       │ │  │  │
│  │                   │  └───────────┬────────────┘ │  │  │
│  │                   └──────────────┼──────────────┘  │  │
│  └──────────────────────────────────┼─────────────────┘  │
│                                     │ HTTPS/HEC          │
│                   ┌─────────────────▼────────────────┐   │
│                   │      Splunk VM                   │   │
│                   │  • HTTP Event Collector (HEC)    │   │
│                   │  • kubernetes_security index     │   │
│                   │  • Real-time event analysis      │   │
│                   └──────────────────────────────────┘   │
└──────────────────────────────────────────────────────────┘
Data Flow
- Tetragon monitors kernel-level events on each cluster node using eBPF probes
- Events are written to
/var/run/cilium/tetragon/tetragon.login JSON format - Fluent Bit DaemonSet tails these logs on each node
- Logs are forwarded to Splunk HEC over HTTPS with TLS
- Splunk ingests events into the
kubernetes_securityindex for analysis and alerting
Prerequisites
Before starting, ensure you have:
- Proxmox Environment: Virtualization host (minimum 16GB RAM recommended)
- Kubernetes Cluster: A running cluster deployed using kubeadm with Cilium CNI
- If you need to set up the base cluster, follow the Base Kubernetes Cluster guide
- Splunk Instance: Either Splunk Enterprise (free version works) or Splunk Cloud
- This guide assumes you have Splunk already deployed and accessible
- SSH Access: To the Kubernetes master node for running kubectl commands
If you need help setting up the Proxmox environment and base Kubernetes cluster, check out the complete setup guide which includes Terraform and Ansible automation for rapid deployment.
Step 1: Installing Tetragon
All commands in this section should be run on your Kubernetes master node. SSH into your control plane and follow these steps.
Add Cilium Helm Repository
First, add the Cilium Helm repository where Tetragon charts are hosted:
1
2
helm repo add cilium https://helm.cilium.io
helm repo update
If you deployed your cluster following the Base01_Kubernetes_Cilium guide, the Cilium Helm repository is already configured and you can skip the
helm repo addcommand.
Deploy Tetragon
Install Tetragon as a DaemonSet in the kube-system namespace:
1
helm install tetragon cilium/tetragon -n kube-system
This deploys Tetragon pods on every node in your cluster, ensuring comprehensive coverage across all workloads.
Verify Deployment
Monitor the rollout status and wait for all pods to be ready:
1
kubectl rollout status -n kube-system ds/tetragon -w
Once the rollout completes, verify the pods are running:
1
kubectl get pods -n kube-system -l app.kubernetes.io/name=tetragon
You should see output similar to this:
1
2
3
4
5
NAME             READY   STATUS    RESTARTS   AGE
tetragon-4fs7d   2/2     Running   0          37m
tetragon-7fbx9   2/2     Running   0          37m
tetragon-kxptv   2/2     Running   0          37m
tetragon-n87ht   2/2     Running   0          37m
Each Tetragon pod runs two containers:
- The main Tetragon agent (eBPF event collection)
- An export-stdout container (log aggregation)
Step 2: Configuring Splunk Integration
Now that Tetragon is collecting security events, we need to send them to Splunk for centralized analysis and long-term storage.
Setting up HTTP Event Collector (HEC)
Splunk’s HEC provides a scalable way to ingest JSON events over HTTPS. Follow these steps to configure it:
Access Splunk Web Interface and log in with admin credentials
- Navigate to HEC Settings:
- Go to Settings → Data Inputs → HTTP Event Collector
- Create New Token:
- Click New Token
- Name:
tetragon-events - Source type: Select
_jsonfrom the dropdown - Index: Create or select an index (recommended:
kubernetes_security)- To create a new index: Settings → Indexes → New Index
- Click Review then Submit
- Copy Token Value:
- Save the token value—you’ll need this in the next section
- Format:
xxxxxxxx-xxxx-xxxx-xxxx-xxxxxxxxxxxx
- Enable HEC Globally:
- Go to Settings → Data Inputs → HTTP Event Collector → Global Settings
- Ensure All Tokens is set to Enabled
- Note the HTTP Port Number (default:
8088) - Click Save
Keep your HEC token secure—it provides write access to your Splunk instance. Treat it like a password.
Step 3: Deploying Fluent Bit for Log Forwarding
Fluent Bit is a lightweight, high-performance log processor and forwarder. We’ll deploy it as a DaemonSet to collect Tetragon logs from each node and forward them to Splunk.
Create Logging Namespace
First, create a dedicated namespace for our logging infrastructure:
1
kubectl create namespace logging
Store Splunk HEC Token as Secret
For security best practices, store the HEC token as a Kubernetes Secret:
1
2
3
kubectl create secret generic splunk-hec-token \
  --from-literal=token='YOUR_SPLUNK_HEC_TOKEN' \
  -n logging
Replace YOUR_SPLUNK_HEC_TOKEN with the actual token from the previous step.
Create Fluent Bit Configuration
Create a ConfigMap that defines how Fluent Bit should collect and forward logs:
1
2
3
4
5
6
7
8
9
10
11
12
13
14
15
16
17
18
19
20
21
22
23
24
25
26
27
28
29
30
31
32
33
34
35
36
37
38
39
40
41
42
cat <<'EOF' | kubectl apply -f -
apiVersion: v1
kind: ConfigMap
metadata:
  name: fluent-bit-config
  namespace: logging
data:
  fluent-bit.conf: |
    [SERVICE]
      Flush        5
      Log_Level    info
      Parsers_File parsers.conf

    [INPUT]
      Name              tail
      Path              /var/run/cilium/tetragon/tetragon.log
      Parser            tetragon_parser
      Tag               tetragon
      Refresh_Interval  5
      Mem_Buf_Limit     5MB
      Skip_Long_Lines   Off

    [OUTPUT]
      Name             splunk
      Match            tetragon
      Host             YOUR_SPLUNK_IP
      Port             8088
      TLS              On
      TLS.Verify       Off
      Splunk_Token      ${SPLUNK_HEC_TOKEN}
      Splunk_Send_Raw  Off
      Event_Source     fluent-bit
      Event_Sourcetype _json

  parsers.conf: |
    [PARSER]
      Name        tetragon_parser
      Format      json
      Time_Key    time
      Time_Format %Y-%m-%dT%H:%M:%S.%LZ
      Time_Keep   On
EOF
Important: Replace YOUR_SPLUNK_IP with your actual Splunk server IP address.
Configuration Breakdown
- INPUT: Tails the Tetragon log file on each node
Path: Where Tetragon writes JSON eventsParser: Parses JSON events with timestamp extractionMem_Buf_Limit: Prevents memory overflow on high-volume events
- OUTPUT: Forwards to Splunk HEC
TLS: Encrypts communication to SplunkTLS.Verify: Set toOfffor self-signed certificates (set toOnin production)Splunk_Token: References the Kubernetes SecretEvent_Sourcetype: Tells Splunk to parse as JSON
Deploy Fluent Bit DaemonSet
Now deploy Fluent Bit to every node in the cluster:
1
2
3
4
5
6
7
8
9
10
11
12
13
14
15
16
17
18
19
20
21
22
23
24
25
26
27
28
29
30
31
32
33
34
35
36
37
38
39
40
41
42
43
44
45
46
47
cat <<'EOF' | kubectl apply -f -
apiVersion: apps/v1
kind: DaemonSet
metadata:
  name: fluent-bit
  namespace: logging
  labels:
    app: fluent-bit
spec:
  selector:
    matchLabels:
      app: fluent-bit
  template:
    metadata:
      labels:
        app: fluent-bit
    spec:
      serviceAccountName: fluent-bit
      containers:
      - name: fluent-bit
        image: fluent/fluent-bit:4.1.1
        env:
        - name: SPLUNK_HEC_TOKEN
          valueFrom:
            secretKeyRef:
              name: splunk-hec-token
              key: token
        volumeMounts:
        - name: varlog
          mountPath: /var/run/cilium/tetragon
          readOnly: true
        - name: fluent-bit-config
          mountPath: /fluent-bit/etc/
      volumes:
      - name: varlog
        hostPath:
          path: /var/run/cilium/tetragon
      - name: fluent-bit-config
        configMap:
          name: fluent-bit-config
---
apiVersion: v1
kind: ServiceAccount
metadata:
  name: fluent-bit
  namespace: logging
EOF
Verify Fluent Bit Deployment
Check that Fluent Bit pods are running on all nodes:
1
kubectl get pods -n logging -l app=fluent-bit
Expected output:
1
2
3
4
NAME               READY   STATUS    RESTARTS   AGE
fluent-bit-csjqf   1/1     Running   0          20m
fluent-bit-hbs8w   1/1     Running   0          20m
fluent-bit-q7c5t   1/1     Running   0          20m
Troubleshooting with Logs
If you encounter issues, check the Fluent Bit logs for connectivity problems or parsing errors:
1
kubectl logs -n logging fluent-bit-q7c5t
Healthy output should look like:
1
2
3
4
5
6
7
8
9
10
11
12
13
14
15
16
17
18
19
20
21
22
23
24
25
Fluent Bit v4.1.1
* Copyright (C) 2015-2025 The Fluent Bit Authors
* Fluent Bit is a CNCF sub-project under the umbrella of Fluentd
* https://fluentbit.io

______ _                  _    ______ _ _             ___   __
|  ___| |                | |   | ___ (_) |           /   | /  |
| |_  | |_   _  ___ _ __ | |_  | |_/ /_| |_  __   __/ /| | `| |
|  _| | | | | |/ _ \ '_ \| __| | ___ \ | __| \ \ / / /_| |  | |
| |   | | |_| |  __/ | | | |_  | |_/ / | |_   \ V /\___  |__| |_
\_|   |_|\__,_|\___|_| |_|\__| \____/|_|\__|   \_/     |_(_)___/


[2025/10/10 07:51:19.808812265] [ info] [fluent bit] version=4.1.1, commit=912b7d783a, pid=1
[2025/10/10 07:51:19.808869583] [ info] [storage] ver=1.5.3, type=memory, sync=normal, checksum=off, max_chunks_up=128
[2025/10/10 07:51:19.808874019] [ info] [simd    ] SSE2
[2025/10/10 07:51:19.808876601] [ info] [cmetrics] version=1.0.5
[2025/10/10 07:51:19.808878982] [ info] [ctraces ] version=0.6.6
[2025/10/10 07:51:19.808945175] [ info] [input:tail:tail.0] initializing
[2025/10/10 07:51:19.808949113] [ info] [input:tail:tail.0] storage_strategy='memory' (memory only)
[2025/10/10 07:51:19.812074575] [ info] [output:splunk:splunk.0] worker #0 started
[2025/10/10 07:51:19.812281803] [ info] [sp] stream processor started
[2025/10/10 07:51:19.812464883] [ info] [engine] Shutdown Grace Period=5, Shutdown Input Grace Period=2
[2025/10/10 07:51:19.812672324] [ info] [input:tail:tail.0] inotify_fs_add(): inode=2228 watch_fd=1 name=/var/run/cilium/tetragon/tetragon.log
[2025/10/10 07:51:19.815375890] [ info] [output:splunk:splunk.0] worker #1 started
Look for:
- Successful tail input initialization
- Splunk output workers starting
- No connection errors or TLS failures
Step 4: Verifying Events in Splunk
With everything deployed, it’s time to verify that security events are flowing into Splunk.
Default Process Execution Monitoring
Tetragon comes with a default process execution monitoring policy out of the box. This means that as soon as Tetragon is deployed, it starts capturing process creation events across your cluster—including the Fluent Bit DaemonSet operations.
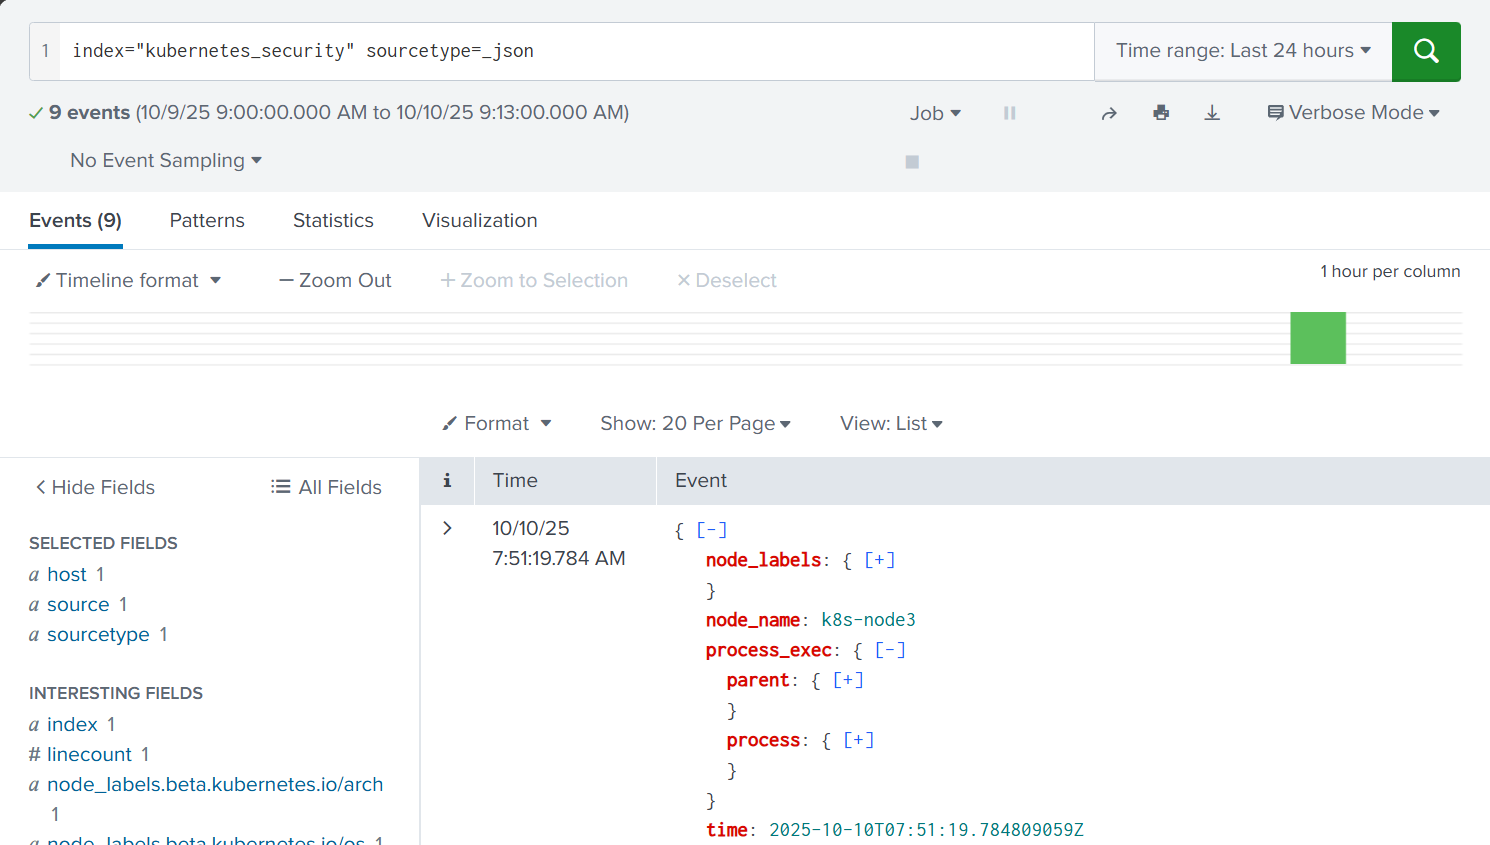
Search for Events
Log into Splunk and navigate to Search & Reporting
Run the following SPL query:
index=kubernetes_security sourcetype=_json
This searches for all JSON events in the kubernetes_security index.
- Examine the Results:
You should see Tetragon events with rich fields like:
process_exec.process.binary: Path to the executed binaryprocess_exec.process.arguments: Command-line argumentsprocess_exec.parent.binary: Parent process that spawned this processprocess_exec.process.pod.name: Pod name where the event occurredprocess_exec.process.pod.namespace: Kubernetes namespaceprocess_exec.process.pod.container.name: Container nametime: Timestamp of the event
Visual Verification
You should see a steady stream of events in Splunk, demonstrating that:
- Tetragon is capturing process execution events
- Fluent Bit is successfully tailing the logs
- Events are being forwarded to Splunk via HEC
- JSON parsing is working correctly
Conclusion
Congratulations! You’ve successfully built a comprehensive Kubernetes security detection lab with:
- Tetragon providing deep, kernel-level visibility using eBPF
- Fluent Bit efficiently forwarding security events
- Splunk centralizing and analyzing security telemetry
This lab serves as a powerful foundation for:
- Learning cloud-native security tools
- Practicing threat detection and incident response
- Understanding container runtime behavior
- Developing custom security policies
The skills you’ve gained are directly applicable to real-world security operations in Kubernetes environments. eBPF-based observability is the future of cloud-native security, and tools like Tetragon are leading the way.